AppTone Questionnaires System
AppTone: Genuine Emotion Analysis for Voice-Based Questionnaires and Audio Responses
Overview
AppTone is one of the "Analyze Now" services that analyzes spoken responses in voice-based questionnaires to provide insights into emotional and psychological states using Layered Voice Analysis (LVA) technology. It is uniquely integrated with WhatsApp (and potentially other voice-enabled chat services) to collect audio responses from users, making it a flexible tool for various applications, including fraud detection, compliance monitoring, customer service, and psychological assessments.
Key Features
1. Advanced Emotion Detection
AppTone utilizes specialized "questionnaire ready" datasets within LVA technology to adapt to various use cases, allowing for the detection of a wide range of emotions such as stress, anxiety, confidence, and uncertainty. Additionally, it evaluates honesty levels and risk factors using professionally calibrated datasets. Note that not all datasets include risk indicators; only certain professional-level datasets provide this capability.
Emotional analysis is independent of spoken content, focusing solely on voice characteristics, and is available for any language without requiring additional tuning.
2. Post-Session Automated Reports
AppTone collects responses via WhatsApp and processes them efficiently to generate automated reports at the end of each session, offering comprehensive emotional insights based on user responses.
3. Fraud Detection
Identifies signs of dishonesty or stress, helping detect potential fraud.
Used in financial transactions, insurance claims, and other high-risk interactions.
4. Customer Feedback and Survey Analysis
AppTone is optimized for post-call surveys and customer feedback collection, enabling businesses to gather meaningful insights through structured voice-based questionnaires.
It can be used to launch specialized tests via QR codes, allowing Emotion Logic's clients to gather emotional insights from their customers.
Helps businesses assess overall sentiment and improve customer experience based on structured feedback.
5. Compliance Monitoring
Organizations can use AppTone to deploy compliance-related questionnaires via WhatsApp or web-based surveys, allowing employees or clients to respond using voice recordings.
The collected responses are analyzed for emotional markers and risk indicators, helping companies identify areas of concern and ensure compliance with industry regulations.
6. Psychological and Psychiatric Applications
AppTone enables the collection and analysis of voice responses to aid mental health assessments.
Assists clinicians in evaluating emotional states and tracking patient progress over time.
7. Personalized Feedback and Training
Provides detailed feedback on communication skills and emotional intelligence.
Helps individuals refine their speaking style for professional and personal development.
Customizable Questionnaires
- AppTone questionnaires can be fully customized to meet diverse needs. Users can create their own questionnaires or use pre-designed templates, enabling deployment in less than five minutes.
- Questions should be framed to encourage longer responses and storytelling rather than simple yes/no answers. This allows for richer audio data collection, leading to more accurate emotional analysis.
How to Send a Questionnaire
To manually send a questionnaire to any party of interest:
- Log into the platform and from the left side menu select "Analyze Now" and "AppTone"
- Select the test you want to send, and copy it to your personal Gallery.
- Click the send button and enter your target person's details and an optional email if you want the report to be sent to an email.
- Click send again on this screen to complete the task.
QR Code Activation: Businesses can generate QR codes linked to specific questionnaires. When scanned, these QR codes initiate the test from the scanner's phone, making it easy forcustomers or employees to participate in evaluations instantly.
Customization and Deployment: Users can create their own questionnaires or select from pre-designed templates, enabling distribution in less than five minutes. To enhance analysis, questions should be structured to encourage detailed responses rather than simple yes/no answers, ensuring richer voice data collection.
How AppTone Works for the receiver:
Initiate a Session
- Testees receive a questionnaire via WhatsApp, a web interface or another voice-enabled chat service.
- They respond by recording and submitting their answers.
Speech-to-Emotion Analysis
- AppTone transcribes the responses while preserving voice data for emotional analysis.
- LVA detects emotional markers in the voice, assessing stress, confidence, hesitation, and other psychological cues.
AI-Driven Cross-Referencing
- Emotions detected in the voice are cross-referenced with verbal content.
- This helps identify discrepancies between what was said and how it was emotionally conveyed.
Automated Report Generation
- At the end of the session, a structured report is generated with emotional and risk insights.
- The report includes key findings relevant to fraud risk, compliance, customer sentiment, or mental health evaluation.
Use Case Examples
- Fraud Prevention: Detects emotional inconsistencies in insurance claims and financial transactions and pin-points relevant high risk topics and answers.
- Customer Sentiment Analysis: Helps businesses measure customer satisfaction and identify concerns.
- HR and Recruitment: Assesses candidates' emotional responses in interview settings for true personality assessment, Core-Values-Competencies evaluation, as well as risk indications around topics relevant for the company's protection .
- Mental Health Monitoring: Supports therapists in tracking emotional health trends over time.
Getting Started
To integrate AppTone into your workflow or explore its capabilities, visit EMLO’s AppTone page.
AppTone
Connecting emotions, voice, and data, providing insightful analysis independent of tonality, language, or cultural context.
AppTone uses WhatsApp to send questionnaires for a range of purposes, such as market research, insurance fraud detection, credit risk assessment, and many more. AppTone uses cutting-edge technologies to gather voice answers, analyze them, and produce extensive automated reports.
Introduction
What is Apptone?
Apptone analyzes customer emotions through voice responses to questionnaires sent via messaging apps. It provides a thorough and effective way to record, transcribe, analyze, and derive insights from spoken content. Depending on the assessed field, a set of questions — a questionnaire — is sent to the applicant via messenger. The applicant records the answers, and the AppTone analyzes the voice recordings and generates the report, with all the key points evaluated and flagged if any issues are detected.
AppTone provides:
- Ease of Use
Customers enjoy a straightforward and personal way to communicate their feedback, using their own voice through familiar messaging platforms, making the process fast and user-friendly.
- Rapid Insights
AppTone enables businesses to quickly process and analyze voice data, turning customer emotions into actionable insights with unprecedented speed.
- Personalized Customer Experience
By understanding the nuances of customer emotions, companies can offer highly personalized responses and services, deepening customer engagement and satisfaction.
How It Works
First step
You initiate the process by choosing the right questionnaire, either a preset or a custom one, made on your own.
Questionnaire dispatch
AppTone sends a tailored voice questionnaire directly to the applicant's phone via a popular messaging app. This makes it possible for candidates to record their responses in a comfortable and relaxed setting.


Fig. 1: Example of a Questionnaire Sent to the Recipient
Response recording
The applicants record the answers to the questionnaire whenever it is most convenient for them, preferably in a quiet, peaceful environment.
Instant analysis
Following submission of the responses, the recordings are processed instantly by AppTone, which looks for fraud and risk indicators.
The analysis is powered by Layered Voice Analysis (LVA), a technology that enables the detection of human emotions and personalities for risk-assessment calculations.
More on Layered Voice Analysis (LVA) Technology.
Reporting
A detailed report with decision-making information related to the chosen area is generated and delivered to the customer within seconds. This report includes actionable insights, enabling quick and informed decision-making.
The analysis is conducted irrespective of language or tone, and you can even use ChatGPT Analysis to get more AI insights.
Through the analysis of voice recordings from any relevant parties, Apptone is able to identify subtle signs of dishonesty, including, but not limited to:
- Changes in Vocal Stress: Individuals who fabricate information or feel uncomfortable with deception may exhibit changes in vocal stress levels.
- Inconsistencies in Emotional Responses: The technology can identify discrepancies between the emotions expressed in the voice and the situation described, potentially revealing attempts to exaggerate or feign symptoms.
- Linguistic Markers of Deception: Certain word choices, sentence structures, and hesitation patterns can indicate attempts to mislead.
AppTone Advantages
- Ease of Use for Customers: Through recognizable messaging platforms, customers have a simple and intimate means of providing feedback in their own voice, which expedites and simplifies the process.
- Quick Insights for Businesses: AppTone helps companies process and analyze voice data fast, converting client emotions into actionable insights with unprecedented speed.
- Personalized Customer Experience: Businesses can increase customer engagement and satisfaction by providing highly tailored responses and services by comprehending the subtleties of customers' emotions.
What do We Get out of the Result?
Depending on the specific Questionnaire chosen or created by the customer, after Apptone completes the analysis, the customer receives a detailed Report, with all the key points evaluated and flagged if any issues are detected.
If we take a Candidate Insight Questionnaire as an example, the Report will contain:
- Test Conclusion, which provides you with information about the transcription, AI insights, and emotional analysis by summarizing the reporting results.

Fig. 2: Extract from the Report: Test Conclusion
- The Personality Core Type of a candidate and Emotional Diamond Analysis.
There are four Personality Core Types:
1. Energetic Logical
Characterized by directness, decisiveness, and dominance, this style prefers leadership over followership. Individuals with this style seek management positions, exhibiting high self-confidence with minimal fear of consequences. Energetic and mission-focused, they are logical-driven risk-takers who passionately defend their beliefs and engage in arguments when disagreements arise.
2. Energetic Emotional
Thriving in the spotlight, this style enjoys being the center of attention. Individuals are enthusiastic, optimistic, and emotionally expressive. They place trust in others, enjoy teamwork, and possess natural creativity. While they can be impulsive, they excel at problem-solving and thinking outside the box. This personality type tends to encourage and motivate, preferring to avoid and negotiate conflicts. However, they may sometimes display recklessness, excessive optimism, daydreaming, and emotional instability.
3. Stressed Emotional
Known for stability and predictability, this style is friendly, sympathetic, and generous in relationships. A good listener, they value close personal connections, though they can be possessive. Suspecting strangers, they easily feel uncomfortable. Striving for consensus, they address conflicts as they arise, displaying compliance towards authority. Under high stress, they exhibit careful behavior, avoiding conflicts even at the cost of giving up more than necessary.
4. Stressed Logical
Precise, detail-oriented, and intensive thinkers, this style excels in analysis and systematic decision-making. They make well-informed decisions after thorough research and consideration. Risk-averse, they focus on details and problem-solving, making them creative thinkers. When faced with proposals, individuals with this style meticulously think through every aspect, offering realistic estimates and voicing concerns. While excellent in research, analysis, or information testing, their careful and complex thinking processes may pose challenges in leading and inspiring others with passion.
The Emotional Diamond Analysis is a visual representation of emotional states and their respective intensities.

Fig. 2.1: Extract from the Report: Personality Core Type and Emotional Diamond Analysis
Risk Assessment according to specific topics, with highlights of the risk points.

Fig. 2.2: Extract from the Report
And Full Report with details on each topic and question, with the possibility to listen to the respondent’s answers.

Fig. 2.3: Extract from the Full Report
Please refer to the Report Types article for more detailed information on the analysis results.
Getting Started
The process of using AppTone is simple, very user-friendly, and consists of several steps. All you have to do is to:
Once the recipient is done with the answers, the system performs the analysis and generates a report with all the details on the assessed parameters and indicators.
Select the Questionnaire
A Questionnaire is a set of questions that are sent to the recipient for further analysis.
You can use a Template (please see the details below) or create a new Questionnaire (please refer to the article Create New Questionnaire).
Use Template
1. Go to Analyze Now > Apptone > Questionnaires Management.

Fig.1: Questionnaires Management Screen
- Templates tab contains the list of Templates which can be further used.
- My Questionnaires tab contains the questionnaires, owned by a user (copied from Templates or created previously).
Note: Sending and editing the Questionnaires is available for My Questionnaires only.
2. Go to Templates tab and select Copy to My Questionnaires button on the needed Questionnaire card.
Once a template has been added to My Questionnaires it can be edited, deleted and sent to the end-user.
Use the filter to sort the Questionnaires by language or category.
Clicking on any place on the card will open the full Questionnaire details. To return to the Questionnaires selection, select Back.
Send the Questionnaire
To one recipient
1. Go to My Questionnaires and select Send on the Questionnaire card to send it right away.
You can select Edit icon to edit the Questionnaire before sending, if needed.

Fig.2: Questionnaire Card
2. Fill in the form:
- Recipient name and phone number.
- Identifier – Create an identifier for this questionnaire. It can be any word or number combination.
- Email for Report to be sent to.
Price details will also be displayed in the form.
3. Select Send.

Fig.3: Send to Customer Pop-up
To multiple recipients
1. Go to My Questionnaires and select Send on the Questionnaire card.
You can select Edit icon to edit the Questionnaire before sending, if needed.
2.Select Upload Your Own List.

3. Download a CSV template and fill in the recipients' details there according to the example that will be inside the file.
4. Upload the list.
The recipients's details can be edited.

Fig 4: Send to Customer - Upload List
3. Select Send to send the questionnaire to the indicated recipients.
The price summarizes all the questionnaires that will be sent.
Get the Report
Once the Questionnaire is sent to the end user, the information on it will appear in the Reports Tab, where you can see the status of the Questionnaire and see the detailed report.
Please refer to the Report Types article to get more information about what the report consists of.
Questionnaires Management Tab
Questionnaires Management Tab allows the user to view and manage questionnaires.
Analyze Now > AppTone > Questionnaires Management will lead you to all the questionnaires available.
- Templates: can not be edited, they can only be viewed and Copied to My Questionnaires.
- My Questionnaires: can be edited, deleted/archived, and sent to customers.
Fig.1: Questionnaire Management screen
Use the Filter to sort the Questionnaires by Language (multiple languages can be selected) or Category.
Click on any place on the card will open the Questionnaire details. To return to the Questionnaires selection select Back.

Fig.2 Questionnaire Details
On the Questionnaires Management tab it is possible to perform the following actions:
- Send Questionnaires to customers
Please, see How to Send Questionnaire for more details.
- Create New Questionnaires
Please, see How to Create New Questionnaire for more details.
- Edit the existing Questionnaires
Please, see How to Edit Questionnaire for more details.
Create New Questionnaire
Please note that creating a new Questionnaire is available for the desktop version only.
To create a new Questionnaire:
- Go to Analyze Now > Apptone, and select Add New.

Fig. 1: Add New Questionnaire Button
There will be three tabs to fill in:

Fig. 2: Create New Questionnaire Tabs
2. Fill in the fields in all three tabs. The required fields are marked with a red dot.
3. Select Create.
A new Questionnaire is now created and can be managed in the Questionnaire Management Tab in Analyze Now > Apptone.
General Tab
This tab consists of general questionnaire configuration settings.

Fig. 3: General Settings of the Questionnaire
- Questionnaire Name – Enter the name for the Questionnaire.
- Language – Select the language of the questions.
- Category – Select a category from the list or enter a new one. Multiple categories can be selected. Adding new categories is available for users with admin rights only.
- Tags – Add tags to the questionnaire for the search. Multiple tags can be entered.
- Description – Enter the description of a new Questionnaire in a free form. This text will be shown on the AppTone home page.
- Card Image – Add a picture for the Questionnaire description that will appear on the Apptone homepage. If no picture is added, a default placeholder will be used.
- Plug Type - Select from a drop-down a plug type. It defines a set of data that will be available in the report according to a specific use case:
- AppTone – Risk Assessment
- AppTone – Human Resources
- AppTone – Personality test – FUN
- AppTone – Well-being
- Price per questionnaire – This field is filled automatically after selecting the plug type. That is how much sending one questionnaire will cost.
- Activation Code (TBC) – If a questionnaire is on public stock, a customer cannot send a code.
- Advertisement Link (TBC).
- Report options – Select which items to include in the Report:
- Show Profiles
- Show Tags
- Show Transcription
- Show Emotional Diamond
- Show Emotion Player
- Show Image
- Main Risk Indicator. This selection determines which risk parameter is used to calculate the risk score per topic.
- Use Objective Risk
- Use Subjective Risk
- Use Final Risk
- Report Delivery Options – Select how the Report will be delivered:
- Send report to email – The .pdf report will be sent to the email specified in the step when the recipient’s details are filled in before sending the Questionnaire.
- Send report in Chat – The .pdf report will be sent in the WhatsApp Chat.
Once all the required fields are filled, the red dot near the tab name will disappear.
Topics & Questions Tab
This tab consists of the configuration relating to the questions sent to the recipient.
Translating options

Fig 4: Translation Settings of the Questionnaire
You can choose one of the supported languages from a drop-down list and automatically translate the questionnaire.
Select + to add a language. Once selected, the new translation will appear. The fields Retry message, Closing message, and Topics and Questions will be translated to the language chosen. You can edit and change the text if needed.

Fig. 5: Topics & Questions Settings of the Questionnaire
- Introduction Message – Select from a drop-down list the opening message the user will receive as an introduction.
- Closing Message – Enter the text in the free form for the last message the user will receive as the last message after completing the questionnaire.
- Retry Message – Select from a drop-down a message the user will receive in case the recording has failed.
- Cancellation (Pull back) Message – Select from a drop-down list a message the user will receive in case there is a need to pull back a sent questionnaire.
- Use Reminder – Use a toggle to turn on the reminder for a user. In cases where the invitation has been sent and the customer hasn’t replied yet, an automatic reminder will be sent.
- Reminder Frequency – Select the frequency of the reminders from a drop-down list.
- Reminder Message – Select from a drop-down list the message that will be sent to a user when reminding them to answer the questions.
Questions table
- Topic column – Enter the topic name for the corresponding question. The questions will be grouped according to topics in the Report.
- Question – Enter the question text in this column.
- Media – Select Add Media to add one or more images, audio, or video files to a questionnaire.
- Type/Relevancy – Select from a drop-down list the option for how this question will be processed and analyzed:
- Personality - These questions aim to assess the respondent's core strengths, weaknesses, and unique personality traits. Responses help identify consistent behavioral patterns and underlying personality characteristics.
- Personality + Risk - This combined category evaluates both personality traits and potential risk factors. It offers insights into the respondent's personality while also assessing their susceptibility to risk, using a dual perspective on personality and risk elements
- Risk - Background - These are broad, introductory questions designed to introduce the topic and ease the respondent into the subject matter. They help set the mental context for the upcoming questions and facilitate a smoother transition between topics.
- Risk - 3rd Party Knowledge - These questions assess the respondent's knowledge of potential third-party involvement, helping to clear any tension related to external knowledge of risky behaviors. This allows for a more accurate focus on the respondent's personal involvement.
- Risk - Secondary involvement - This type focuses on the respondent's indirect or past involvement in risky situations, typically spanning the last five years. It aims to gauge any historical connection to risk-related behavior.
- Risk - Primary Involvement - The most relevant questions in terms of risk assessment, these focus on recent and direct personal involvement in risk-related activities, ideally within the past year. They are designed to detect high-relevancy responses and are central to assessing immediate risk potential.
GPT Instructions Tab
This tab settings allow you to turn on/off the usage of ChatGPT Analysis and generate the explanation to the conclusion made by AI according to the answers provided.

Fig. 6: Extract from the Report when ChatGPT Analysis is Enabled
Use a toggle to Enable ChatGPT Analysis.

Fig. 7: ChatGPT Settings of the Questionnaire
- Report Instructions (ChatGPT) – Enter the instructions for ChatGPT.
Example for Report Instructions (ChatGPT):
Hi chat, your task is to analyze a test transcript for fraud. The transcript includes answers given to an insurance questionnaire by a claimant, together with their genuine emotions and some indications about their honesty reading marked in square brackets. Begin your analysis by reading the entire transcript to understand the claimant's communication style, honesty level, and emotional expression. Understand the overall flow and context of the conversation. Pay special attention to any sections that are particularly intense, conflicted, or where the tone changes significantly. Emotion Analysis: Analyze the emotions encoded in "[]" in the transcript context. Catalog the emotions detected and the associated RISK indications to critical and relevant details of the claim. Note any patterns or anomalies. Contextual Assessment: Compare the observed emotions to what would be expected in such situations and note any deviations and repeating indications around the same issues. Inconsistency Check: Identify discrepancies between the spoken words and the encoded emotions and inconsistencies within the conversation, such as conflicting statements or stories that change over time. Fraud Risk Rating: Keep in mind some level of uncertainty and internal doubt may be expected in answers about locations, numbers, exact time, street names, third-party descriptions, and alike. Use the frequency and severity of risk and internal doubt indications as well as clear inconsistencies to assign a fraud risk rating on a scale of 1 to 5. Assign Risk level 1 to indicate minimal risk and 5 to indicate almost certain fraud. Summary and Hashtag Generation: Write a simple-to-understand summary of your analysis, highlighting key points that influenced your fraud risk rating. Generate a hashtag to represent the risk level using words instead of numbers: For level 1 or 2, use "#RISK-LEVEL-LOW" and tag it as @green for low risk. For level 3, use "#RISK-LEVEL-MID" and tag it as @yellow. For levels 4 or 5, use "#RISK-LEVEL-HIGH" and tag it as @red for high risk. Include specific examples from the transcript that support your assessment and the reasoning behind the chosen risk level and color indicator. Provide all your report in English, except for the color markers. Keep your report around 200 words.
- Temperature box – Free number, default 0 (floating between 0-2).
This parameter relates to the randomness of the generated text, i.e., the selection of words. Higher temperatures allow for more variation and randomness in the created text, while lower temperatures produce more conservative and predictable outputs.
- Report language – Select from a drop-down list the language for the ChatGPT report. Available languages
- Show title image – Use a toggle to show/hide the title image (the image in the report related to the GPT analysis). When a toggle is enabled, fill in the Image Description field.
- Image Description – Enter the description in a free form for the title image.
Once all the required fields are filled in, select Create to save the changes and to create a Questionnaire.
It will further be available in My Questionnaires in the Analyze Now > AppTone > Questionnaire Management Tab.
Edit Questionnaire
Please note: Only the Questionnaires in My Questionnaires section can be edited. Templates can be edited only after they are copied to My Questionnaires. In case the My Questionnaires section is empty, create a new Questionnaire or Copy a Questionnaire from Templates.
Questionnaires created by a user can be edited or changed without limitations, or deleted if required.
To Edit a Questionnaire
Go to Analyze Now > Apptone > Questionnaires Management > My Questionnaires and click the edit icon on the corresponding Questionnaire card.
To Edit a Template
1. Go to Analyze Now > Apptone > Questionnaires Management > Templates and Copy a Template to My Questionnairs selecting the corresponding button on the Questionnaire card.
2. Go to Analyze Now > Apptone > Questionnaires Management > My Questionnaires and click the edit icon on the corresponding Questionnaire card.
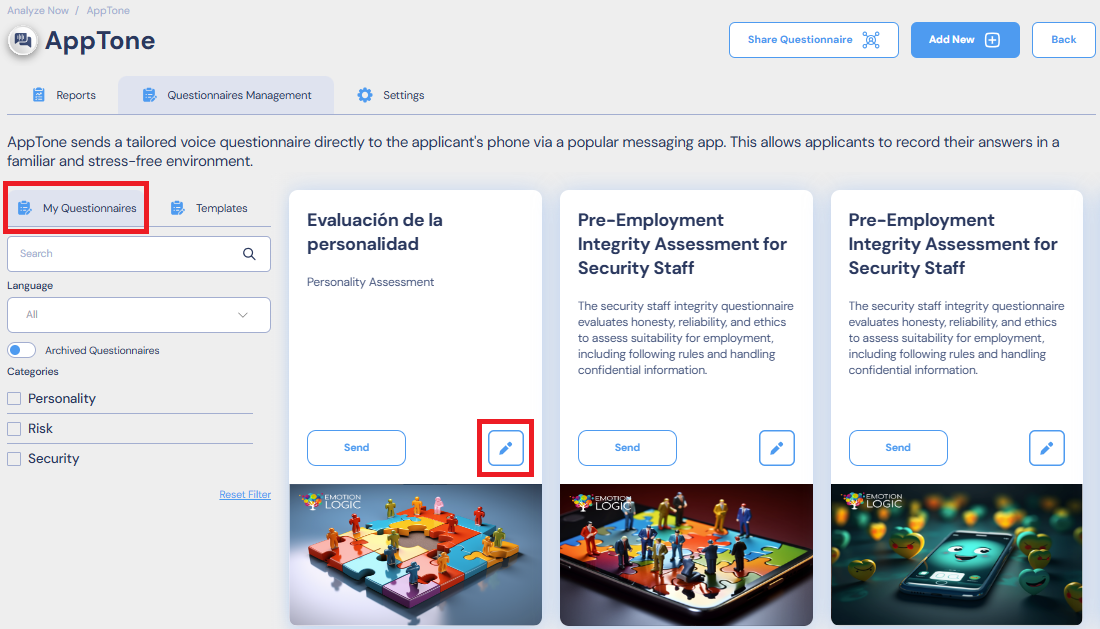
Fig. 1: Edit Questionnaire Button
The Questionnaire details will appear on the screen.

Fig. 2: Edit Questionnaire: General Tab
2. Edit the fields in three tabs according to your requirements and needs.
Please find the details on fields description by the following links:
3. Once the editing is done, select Save.
Now the Questionnaire is ready and can be sent to a customer.
See more about how to Send a Questionnaire.
Reports Tab
The Reports tab shows the overall statistics on the reports, as well as all the reports available. The page consists of three sections:
Display Filters

Fig. 1: Reports: Available Filtration Options
You can select which reports to display, applying the filters available:
- By recipient name (the name defined when sending the questionnaire to the recipient)
- By questionnaire name (defined when editing the questionnaire)
- By period of time (Last 7 days, Per month, Per year)
- By status:
- Pending – the recipient hasn’t completed the questionnaire yet.
- Running – the recipient is in the process of completing the questionnaire.
- Analyzing – the system is analyzing the recipient’s responses.
- Completed – the data analysis is completed.
- Cancelled – the questionnaire has been revoked and is cancelled.
All the filters are applied on the fly. Select Refresh to force the information display to update.
Note: The statistics graph and the reports table will display the information according to the filters applied.
Statistics Graph
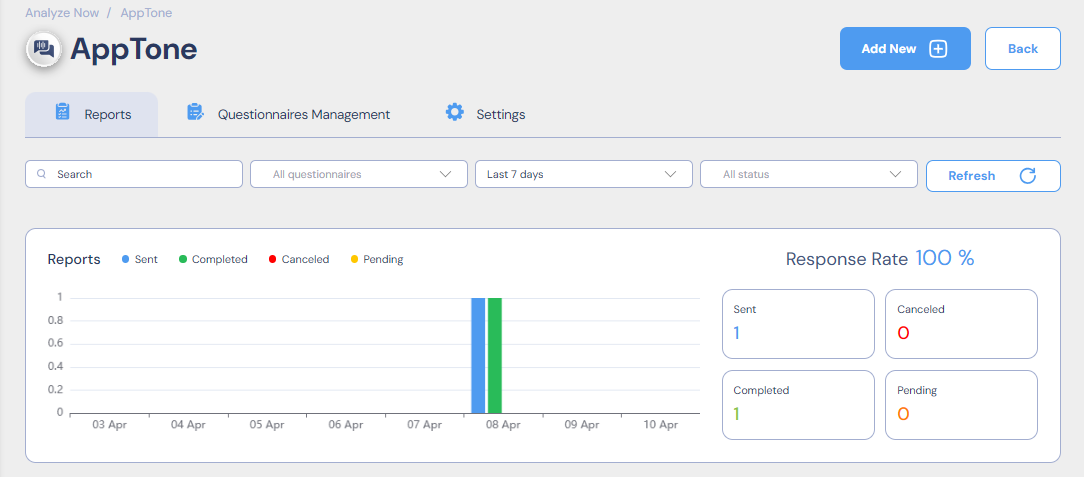
Fig. 2: Reports: Statistics Graph
The statistics graph is a bar chart, where:
- X-axis (horizontal) – period of time selected.
- Y-axis (vertical) – number of reports.
The bar color corresponds to the report status:
- Blue – Sent
- Green – Completed
- Red – Cancelled
- Yellow – Pending
The right part of the graph contains information on Response Rate (%), and the number of reports with a particular Status.
Reports Table
The Reports Table contains a list of all the reports according to the filters applied, with the following details:
- Name – Recipient name, entered in the step of sending the questionnaire.
- Questionnaire Name.
- Conclusion – General conclusion made after the analysis, depending on the report type.
- Phone Number of the recipient, to whom the questionnaire was sent.
- Identifier – Identification number of the recipient, entered in the step of sending the questionnaire.
- Status of the questionnaire and analysis.
- Create Date when a questionnaire was created.
- Start Date when a recipient started answering the questionnaire.
- End Date when a recipient finished answering the questionnaire.
- Completed Date when a recipient finished answering the questionnaire.
The Columns can be sorted by name (alphabetically ascending or descending) by clicking the icon ![]() .
.
Click on the Name to open the report for this recipient.
Click on the Questionnaire Name to open the Questionnaire details.

Fig. 3: Reports Table
Please refer to the Report Types article for more detailed information about what the Report consists of and how to read it.
Hover on the Report line to select from the possible actions, the icons will appear on the right:
- Download as a .pdf file.
- Delete the Report.

Fig. 4: Reports: Download and Delete Buttons
You can also select multiple Reports to download or delete; just tick the needed ones, or tick the first column to select all.

Fig. 5: Reports: Multiple Selection Options
To open the Report click on its name in the table. Please refer to the Report Types article for more detailed information about what the Report consists of.
Report Types
This article provides information on what each type of the report consists of.
Basically, there are three types of reports: Risk, Personality, and a mixed one: Personality + Risk. We will explain each section of the report one by one, giving you an overall understanding of how to read the outcoming result.
General Information
The data provided in the Report may vary and depends on the Questionnaire configuration, i.e., what report options were selected for the particular Questionnaire in the General Tab of the Questionnaires Management. These settings affect the way the report appears and what kind of report it is.
More on Questionnaire Configuration.

Fig. 1: Questionnaires Management: General Settings
Basically, there are three types of reports:
Please refer to the sections below to find the relevant information on each type of the Report.
Report Page
The upper section of the page refers to the report display and contains several tabs:
- Report tab shows this report.
- JSON tab shows the JSON response of this request in a built-in JSON viewer.
- Developers tab will show instructions and source code.
And download options:
- The download icons on the right let you download the report in the respective formats: JSON, PDF, and CSV.

Fig. 2: Report: Display and Download Options
All further information in the report is divided into sections, and is grouped accordingly. The sections are collapsed by default, which makes it easier to navigate.
The sections description is given below, according to the Report Type.
Risk Report
Risk assessment primary goal is to identify whether or not we detected potential risks in specific respondents replies to the Questionnaire.
The first section contains general information on the Report, such as:
- Report Name: name provided by the user to name the report.
- Test Type: the type of test as defined by the AppTone back office.
- Date when the Report was generated.
![]()
Fig. 3: Risk Report: General Risk Score
Test Conclusion
It shows the General Risk Score of the respondent.
Low Risk: Score: 5-40
No significant indications of risk were detected. If the provided information is logically and textually acceptable, no additional investigation is required.
Medium Risk: Score: 41-60
Review the questions that contributed to the elevated risk. It is advisable to conduct a follow-up interview to further explore the topic, focusing on more specific and detailed questions to clarify the underlying reasons for the increased risk.
High Risk: Score: 61-95
The applicant displayed extreme reactions to the questions within the specific topic. The provided information should be carefully reviewed and subjected to further investigation to address any concerns.

Fig. 4: Risk Report: General Risk Score
If the ChatGPT option was enabled (Questionnaires Management > GPT Instructions > Enable ChatGPT Analysis), this section will also contain the ChatGPT conclusion:

Fig. 5: Risk Report: ChatGPT Summary for Test Conclusion
Topic Risk Report
The Topic Risk Report aggregates all the topics and shows the risk indications for each one, as well as whether there is an indication of Withholding Information in the topic.

Fig. 6: Risk Report: Topic Risk Report Section
Risk Highlights
The Risk Highlights section shows the following highlights if they were detected:
- General: Withholding information, General Stress, Aggression, or Distress.
- Questions: Highlights of the detected risk points in the respective questions, marked accordingly:
- Red – High risk level.
- Yellow – medium risk level.
The Risk Highlights section can be copied.

Fig. 7: Risk Report: Risk Highlights Section
Full Report
The Full report section contains detailed analysis and risk indicators for each question answered.
The questions are grouped according to Questionnaire topics.
Each Topic and question can be collapsed.
Questionnaire Topics
This section displays:
- Topic Name – Set by the user in the Questionnaires Management > Topics & Questions Tab.
- Topic Risk – Risk indicator per topic.
- State of Mind – Indications of the respondent’s state per topic: Logical, Stress, Hesitation, Emotion Logic Balance, etc.
- All the Questions included in this topic.

Fig. 8: Risk Report: Topic Section
Question
The Question section contains the indicators for each question on the topic, with the following details:
- Question number – appears in green, orange, or red according to the risk value of the question, with a color-coded alert icon.
- Question text with Volume and Noise level icons next to it.
- Playback of the recording.
- Transcription of the audio reply, if available, with risk indications color-coded.
Note: If the question is masked as containing PII, the transcription will not be available.
- Risk Analysis section – shows the risk assessment per question, with:
- Question’s risk score and Indications relating to Sense of Risk, Inner Conflict, and Stress Level:
- Sense of Risk measures multiple emotional variables to assess the speaker's level of self-filtering and emotional guard.
High values suggest that the speaker strongly desires to avoid the subject or the situation, or feels at risk. - Inner Conflict focuses on acute risk indications that are compared to the speaker's emotional baseline.
High values suggest an inner conflict between what the speaker knows and what they are expressing verbally. - Stress refers to the general level of “danger” or negative expectation the subject felt when discussing the topic/question.
The higher the stress level is, the more sense of jeopardy the subject attaches to the topic at hand.
- Sense of Risk measures multiple emotional variables to assess the speaker's level of self-filtering and emotional guard.
- Question’s risk score and Indications relating to Sense of Risk, Inner Conflict, and Stress Level:
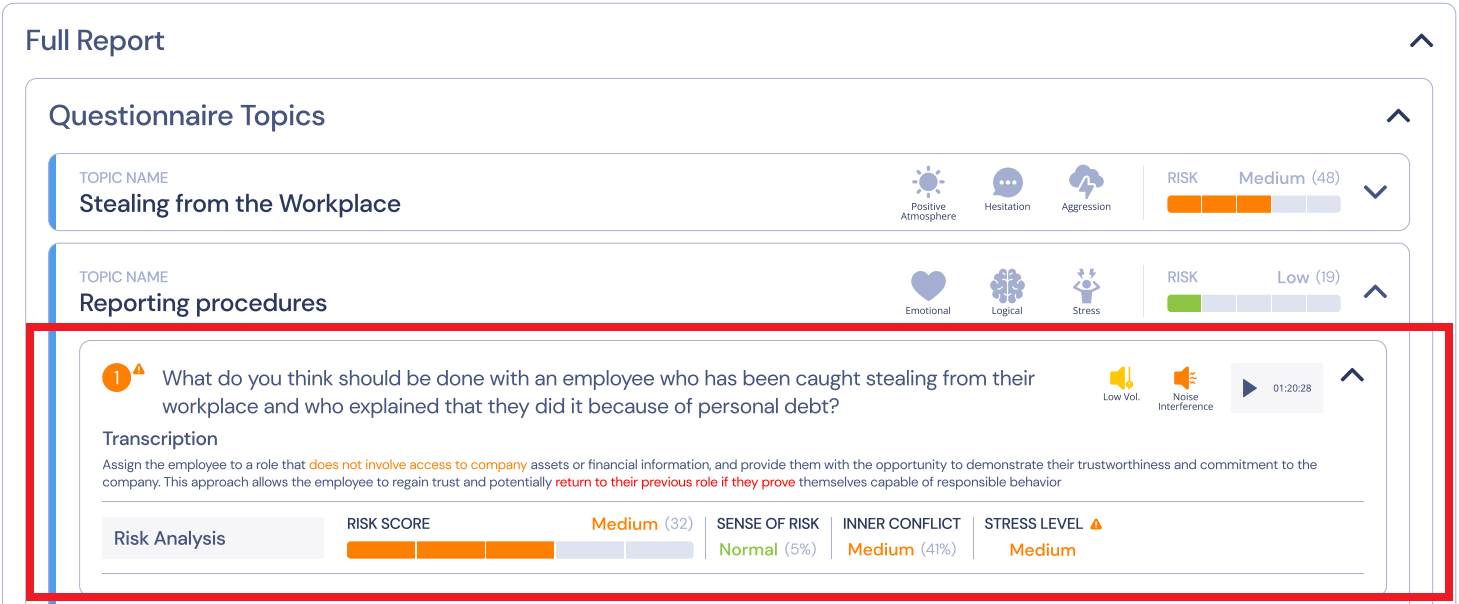
Fig. 9: Risk Report: Question Section
Profiles
This section shows the indicators of Emotions profiles and the state of a respondent for each of them.
Stress Profile
CLStress Score – Summarizes general stress level behavior and indicates the recovery ability from acute stress spikes.
Stress – Indicates how nervous or concerned the speaker is. Note that spikes of stress are common.
Extreme Stress Counters – Extreme stress counters track the number of extreme stress segments and consecutive stress portions detected in the call.
Mood Profile
Evaluation of mood detected. Percentage of Joy, Sadness, and Aggression.
Behavioral Profile
Hesitation – Indicates the speaker's self-control during the conversation. Higher values suggest significant care and hesitation in speech, while low values indicate careless speaking.
Concentration – Indicates how focused and/or emotionally invested in the topic the speaker is.
Anticipation – Indicates the speaker's expectation for the listener's response. It may indicate interest, engagement, or an attempt to elicit a desired response through conscious manipulation.
Emotional Profile
Excitement – Indicates percentages of excitement levels detected throughout the recording.
Arousal – Indicates percentages of a profound interest in the topic of conversation (positive or negative), or arousal towards the conversation partner.
Uneasiness – Indicates percentages of uneasiness or embarrassment levels detected in the recording.
Logical Profile
Uncertainty – Indicates the speaker's certainty level. Lower values mean higher confidence, while high values suggest internal conflict and uncertainty.
Imagination – Indicates percentages of profound cognitive efforts and potential mental 'visualization' employed by the speaker.
Mental Effort – The detected percentages of mental effort intensities reflecting the level of intellectual challenge.
Mental Effort Efficiency – Measures two aspects of the thinking process: the level of mental effort and how efficient the process is. Low mental effort and high efficiency are optimal.
Atmosphere
Indicates the overall positive/negative mood tendency. A high percentage of low atmosphere suggests potential problems.
Discomfort
Indicates the speaker's level of discomfort and potential disappointment at the beginning of the call compared to the end.

Fig. 10: Risk Report: Emotions Profiles Section
Emotion Player
Note: Emotion Player is shown only if it was enabled in the Questionnaire settings (Questionnaires Management > General > Show Emotional Player).
This player combines all audio recordings included in the questionnaire within a single Emotion+Risk player and displays a playable, color-coded visualization of both the emotion detected across the audio recording, as well as risk indicators.
This dataset can demonstrate the significant emotions and risk indicators in every section of the session, with each emotion represented in its own color, providing a quick overview as well as the ability to play back significant sections:
- Risk: risk level detected within the reply, where red is the highest, orange – medium, and green – low.
- Emotions: the range of emotions within the replies. Blue – sad, Red – aggression, Joy – green. The brighter the color – the more intense emotions were detected.
- Stress: the level of stress during the replies. Stress is visualized by the intensity of the yellow color.
- Energy: the level of energy during the replies. Energy is visualized by the intensity of the grey color, where white is the highest.
The different recordings are shown on the player timeline, separated by a thin white line.
When a specific recording is being played, the name of the question is shown under the timeline.

Fig. 11: Risk Report: Emotion Player
Tags
This section displays all the tags added to the Questionnaire in its settings (Questionnaires Management > General > Tags).

Fig. 12: Risk Report: Tags Section
Personality Report
Personality assessment primary goal is to identify the respondent’s strengths and weaknesses, to identify the specific personality traits according to the responses to the Questionnaire.
The first section contains general information on the Report, such as:
- Report Name: name provided by the user to name the report.
- Test Type: the type of test as defined by AppTone back office.
- Date when the Report was generated.
Test Conclusion
Test Conclusion is the overall final conclusion based on the analysis results.
The Summary section provides the explanation made by the ChatGPT for the test conclusion.
Note: The Summary section is shown only if it was enabled in the Questionnaire settings (Questionnaires Management > GPT Instructions Tab > Enable ChatGPT Analysis).

Fig. 13: Personality Report: Test Conclusion Section
Personality Core Type
This section shows what type of personality the respondent demonstrated during the assessment.
It also contains a snapshot of the Emotional Diamond, which displays the range of most meaningful emotions that were captured during the survey.
Note: The Emotion Diamond section is shown only if it was enabled in the Questionnaire settings (Questionnaires Management > General Tab > Show Emotion Diamond).
There are four Personality Core Types:
1. Energetic Logical
Characterized by directness, decisiveness, and dominance, this style prefers leadership over followership. Individuals with this style seek management positions, exhibiting high self-confidence with minimal fear of consequences. Energetic and mission-focused, they are logical-driven risk-takers who passionately defend their beliefs and engage in arguments when disagreements arise.
2. Energetic Emotional
Thriving in the spotlight, this style enjoys being the center of attention. Individuals are enthusiastic, optimistic, and emotionally expressive. They place trust in others, enjoy teamwork, and possess natural creativity. While they can be impulsive, they excel at problem-solving and thinking outside the box. This personality type tends to encourage and motivate, preferring to avoid and negotiate conflicts. However, they may sometimes display recklessness, excessive optimism, daydreaming, and emotional instability.
3. Stressed Emotional
Known for stability and predictability, this style is friendly, sympathetic, and generous in relationships. A good listener, they value close personal connections, though they can be possessive. Suspecting strangers, they easily feel uncomfortable. Striving for consensus, they address conflicts as they arise, displaying compliance towards authority. Under high stress, they exhibit careful behavior, avoiding conflicts even at the cost of giving up more than necessary.
4. Stressed Logical
Precise, detail-oriented, and intensive thinkers, this style excels in analysis and systematic decision-making. They make well-informed decisions after thorough research and consideration. Risk-averse, they focus on details and problem-solving, making them creative thinkers. When faced with proposals, individuals with this style meticulously think through every aspect, offering realistic estimates and voicing concerns. While excellent in research, analysis, or information testing, their careful and complex thinking processes may pose challenges in leading and inspiring others with passion.

Fig. 14: Personality Report: Emotion Diamond Section
Full Report
The Full report section contains detailed analysis and personality assessment indicators for each question answered.
The questions are grouped according to Questionnaire topics.
Each Topic and question can be collapsed.
Questionnaire Topics
This section displays:
- Topic Name – set by the user in the Questionnaires Management > Topics & Questions Tab.
- State of Mind – indications of the respondent’s state per topic: Logical, Stress, Hesitation, Emotion Logic Balance, etc.

Fig. 15: Personality Report: Topic Section
Question
The Question section contains the indicators for each question of the topic, with the following details:
- Question number, text and Volume and Noise level icons next to them.
- Playback of the recording.
- Transcription of the audio reply, if available.
Note: If the question is masked as containing PII, the transcription will not be available.
- Strengths / Challenges section.

Fig. 16: Personality Report: Question Section
Strengths / Challenges
Strengths / Challenges section talks about whether the reply to the question seems to indicate that the topic is generally challenging for a person or whether this topic is actually a strength and a person is confident about what he is saying.
The section displays the following indicators:
- Overall Strengths level (muscle flex for strength
 ), where 5 icons are the highest level and 1 is the lowest, or Overall Challenges level (pushing rock uphill
  ), where 5 icons are the highest level and 1 is the lowest.
 - Points for each 5 major states, with values from 0 to 5 (Confidence, Hesitation, Excitement, Energy, Stress).
- Personality traits section with a scale showing which traits/behavior a person is more inclined to:
- Authentic motivation vs Social conformity: whether a person is motivated and believes in what he is saying or is trying to give a right answer.
- Caution communication vs Open expression: this is like a self-filtering, whether a person is speaking freely and openly, without self judging.
- Emotion driven vs Logic driven: whether a person is guided more by emotions or logic.

- Key Emotions level captured within the reply (Sadness, Aggression, and Joy).

Profiles
This section shows the indicators of Emotions profiles and the state of a respondent for each of them.
Stress Profile
CLStress Score – Summarizes general stress level behavior and indicates the recovery ability from acute stress spikes.
Stress – Indicates how nervous or concerned the speaker is. Note that spikes of stress are common.
Extreme Stress Counters – Extreme stress counters track the number of extreme stress segments and consecutive stress portions detected in the call.
Mood Profile
Evaluation of mood detected. Percentage of Joy, Sadness, and Aggression.
Behavioral Profile
Hesitation – Indicates the speaker's self-control during the conversation. Higher values suggest significant care and hesitation in speech, while low values indicate careless speaking.
Concentration – Indicates how focused and/or emotionally invested in the topic the speaker is.
Anticipation – Indicates the speaker's expectation for the listener's response. It may indicate interest, engagement, or an attempt to elicit a desired response through conscious manipulation.
Emotional Profile
Excitement – Indicates percentages of excitement levels detected throughout the recording.
Arousal – Indicates percentages of a profound interest in the topic of conversation (positive or negative), or arousal towards the conversation partner.
Uneasiness – Indicates percentages of uneasiness or embarrassment levels detected in the recording.
Logical Profile
Uncertainty – Indicates the speaker's certainty level. Lower values mean higher confidence, while high values suggest internal conflict and uncertainty.
Imagination – Indicates percentages of profound cognitive efforts and potential mental 'visualization' employed by the speaker.
Mental Effort – The detected percentages of mental effort intensities reflecting the level of intellectual challenge.
Mental Effort Efficiency – Measures two aspects of the thinking process: the level of mental effort and how efficient the process is. Low mental effort and high efficiency are optimal.
Atmosphere
Indicates the overall positive/negative mood tendency. A high percentage of low atmosphere suggests potential problems.
Discomfort
Indicates the speaker's level of discomfort and potential disappointment at the beginning of the call compared to the end.
Fig. 17: Personality Report: Emotions Profiles Section
Emotion Player
Note: The Emotion Player section is shown only if it was enabled in the Questionnaire settings (Questionnaires Management > General Tab > Show Emotion Player).
Basically, it shows what happened emotionally in different parts of the recording in terms of Emotions, Stress, and Energy. The scale is color-coded and defines:
- Emotions: the range of emotions within the replies. Blue – sad, Red – aggression, Joy – green. The brighter the color – the more intense emotions were detected.
- Stress: the level of stress during the replies. Stress is visualized by the intensity of the yellow color.
- Energy: the level of energy during the replies. Energy is visualized by the intensity of the grey color, where white is the highest.
This player combines all audio recordings included in the questionnaire within a single Emotion only player.
The different recordings are shown on the player timeline, separated by a thin white line.
When a specific recording is being played, the name of the question is shown under the timeline.

Fig. 18: Personality Report: Emotion Player
Tags
This section displays all the tags added to the Questionnaire in its settings (Questionnaires Management > General > Tags).
Fig. 19: Personality Report: Tags Section
Personality + Risk Report
This type of report uses both the indicators for risk assessment and personality assessment. It consists of the same sections, with a slight difference in their display.
Let us consider the differences.
Key Strengths & Challenges
A mixed report has a separate section for Key Strengths & Challenges.
Note: It is possible that there may not be enough data to detect key Strengths & Challenges. In this case, the section will not be shown.
The section displays the top 3 Strengths & Challenges that were detected, and the relevant topic and question for each point.
The value from 1-5 of the strength/challenge is represented in icons (muscle flex icon for strength, pushing rock uphill icon for challenge).

Fig. 20: Personality + Risk Report: Key Strengths & Challenges Section
Full Report
The next difference is that in the full report, the question section contains both risk indicators and personality indicators.
Risk indicators:
- Risk Level for each topic.
- Question number is color-coded, according to the risk level detected.
- Risk Analysis section with risk indicators.

Fig. 21: Personality + Risk Report: Risk Indicators of the Question
Personality indicators:
- Strengths / Challenges section.

Fig. 22: Personality + Risk Report: Strengths / Challenges Section
Emotion Player
The player combines all audio recordings included in the questionnaire within a single Emotion only player.

Fig. 23: Personality + Risk Report: Emotion Player
Settings Tab
The Settings tab relates to Twilio Settings. In case you would like to use your own Twilio account for managing WhatsApp settings, you will have to fill in the fields with the corresponding values. Please see below how to do that.
About Twilio
Basically Twilio is a platform that manages sending of messages in WhatsApp to users to complete a questionnaire. To use Twilio's Messaging APIs with WhatsApp, you will need a WhatsApp-enabled phone number, also referred to as a WhatsApp Sender.
Please, refer to Twilio documentation to register your first WhatsApp Sender and to get all the details on configuring the Twilio account:
Apptone Settings Tab

In case you wish to use your own Twilio account, please complete the following steps:
1. Create and configure your Twilio account.
2. Use a toggle to turn on Custom settings in the Apptone settings page.
3. Fill in the fields:
- WhatsApp Phone Number is the WhatsApp Sender phone number from which messages will be sent to users who will complete the questionnaires.
To create a WhatsApp sender in Twilio:
3.1.1 Open your Twilio account console https://console.twilio.com/.
3.1.2 Go to Explore Products > Messaging section.
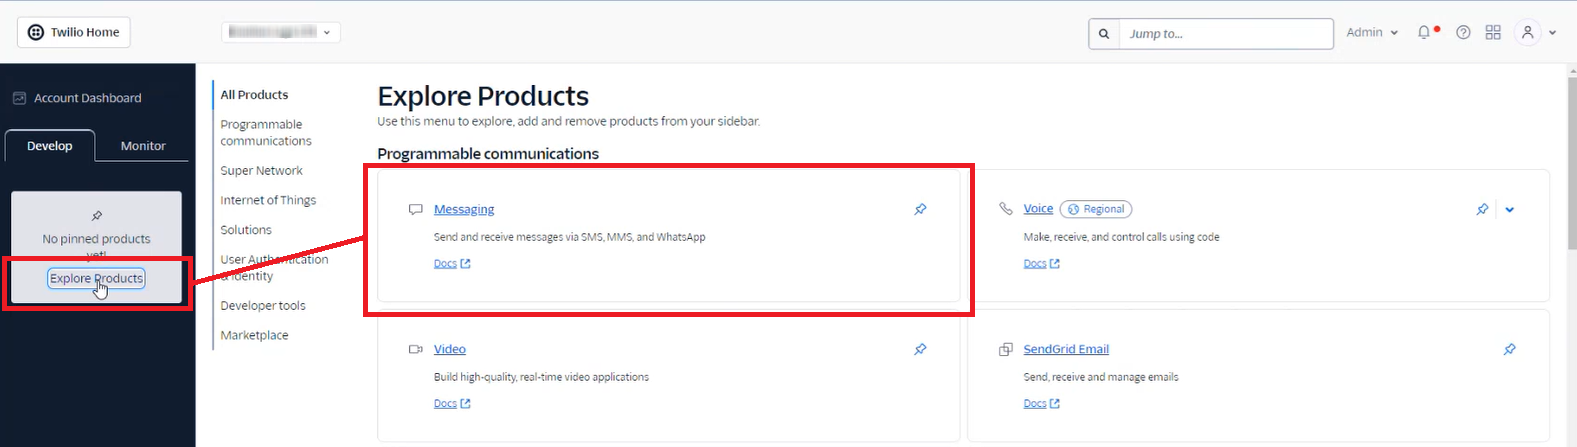
3.1.3 Go to Senders subsection > WhatsApp Senders and select Create new sender.

3.1.4 Follow the steps on the screen to complete the New sender creation.
The new sender will be displayed in the list of your senders.
3.1.5 In the AppTone settings page fill in the WhatsApp Phone Number field with this sender phone number.

- Account SID relates to the authentication in the Twilio platform. The Account SID value can be found in the Account info section of your Twilio account.

- Messaging Service Sid is the identification number of the messaging service.
To get this value you need first to create such a service in your Twilio account:
3.2 Go to Messaging > Services in Twilio console and select Create Messaging Service.

3.2.2 Follow the instructions on the screen, and make sure you select the needed Sender in Step 2, which number you enter in the filed WhatsApp Phone Number in Apptone settings page.

3.2.3 After the Messaging Service is created, you will see it in the list of Messaging Services. Click on the needed service to get its SID.

3.2.4 Paste this value into the Messaging Service Sid field of the Apptone settings page.
4. Select Save to save the changes.

After you save the changes the Webhook URL field will be filled out automatically.
5. Copy Webhook URL field value and paste into the field Webhook url for incoming messages field of your WhatsApp Sender Endpoint confuguration page.
5.1 Go to Messaging > Senders > WhatsApp senders, and select the needed sender.
5.2 Select Use webhooks configuration.
5.3 Paste the value from Apptone settings page into the Webhook url for incoming messages field.

It's done! Twilio configuration is completed.
Message templates
This settings section relates to the message templates sent to the users, i.e. you can create and send your own Introduction / Retry / Closing / Cancellation (Pull Back) / Failure messages.
You can create the templates in the Apptone account and manage them in the Twilio account.
1. Select Add to add a template.
2. Fill in the form.and select Save.

The new template will be displayed in the list with the corresponding status.
3. Go to Messaging > Content Template builder to configure added templates in your Twilio account.

Other important Twilio settings
For security reasons we also recommend enabling the HTTP Basic Authentication for media access to protect your data.
To do that go to Settings > General in your Twilio account page.
